Feminists love statistics. This started as an argument on the internet. I had commented on a November 13, 2014 article[1] in the Sydney Morning Herald, which quoted the Australian Labor politician and then opposition MP Tanya Plibersek on why she is a feminist. The piece did not mention it, but it was clear that it was in response to an earlier statement by the contemporary Foreign Minister Julie Bishop, asserting that she is not a feminist[2] and was generally in the spirit of the tit-for-tat style of Australian politics. They were the usual things one hears from feminists; that it’s a challenge to have both kids and a career, but that feminism helps. The pay gap. The 1 in 5 women “thing.”
…At that statement, I paused, having not come across that statistic here, I thought it originated from an infamous American college campus rape study, unproven to apply in Australia. I thought so, because it sounded similar, but upon rereading the article I noticed that it was a slightly different statement:
“I am a feminist because I know it’s unacceptable that one in every five Australian women will experience sexual assault and one in every three Australian women will experience domestic violence in their lifetimes.”
The person I was arguing with was very kind to point out where this figure might have come from and that is how I became acquainted with the Australian Bureau of Statistics Personal Safety Study.
This “1 in 5” figure is extremely prevalent. Almost every Australian site dealing with family and sexual violence mentions it. They include it in their brochures and online graphics, which commonly look like this, this one being from Australia’s National Organisation for Women’s Safety (ANROWS)[3]:
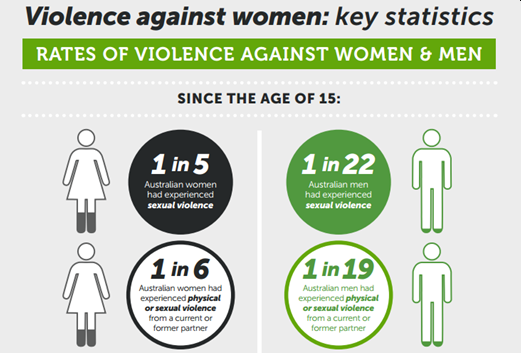
As one can see there is a 1 in x theme throughout. The actual data, Table 1 of the 2012 PPS looks like this[4]:
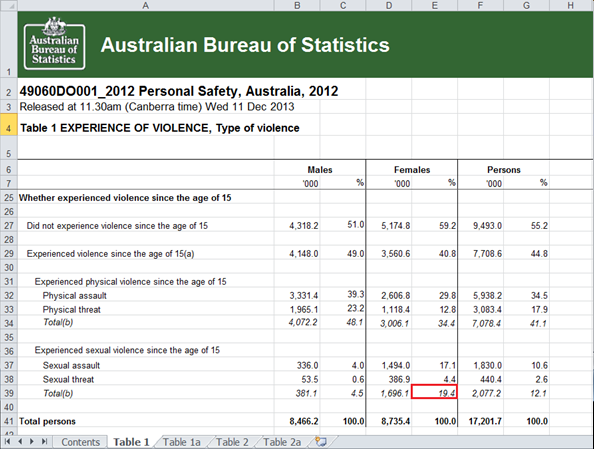
With the source of the 1 in 5 figure highlighted in red. Note that it is a summary of two figures above it – actual sexual assault and a threat thereof with the real estimated lifetime sexual assault figure being closer to 1 in 6.
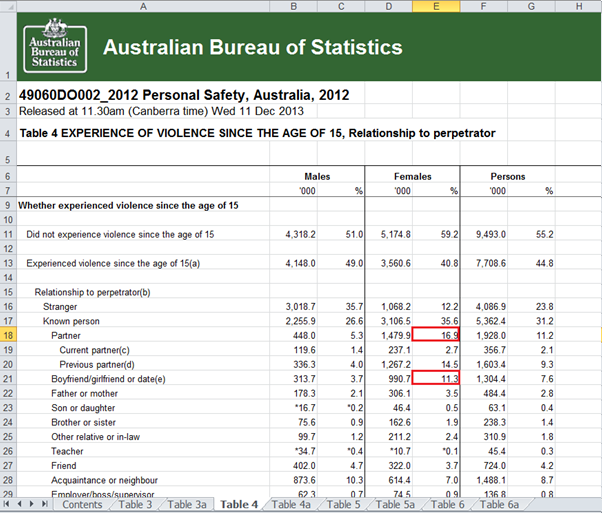
The notion that “1 in 3 women will suffer domestic abuse in their lifetimes” may originate from either Table 22 or Table 4 of the same study:
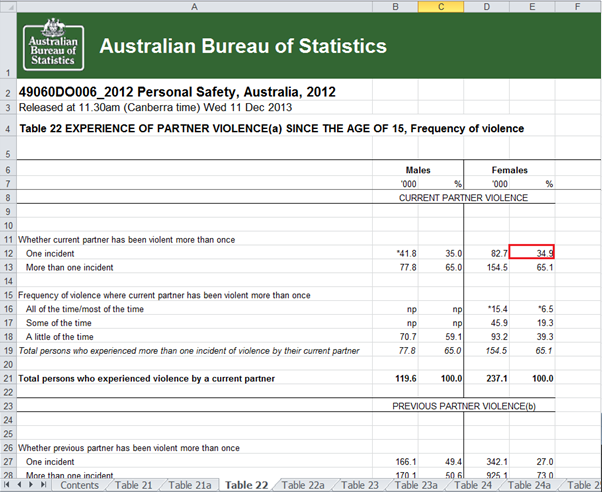
If this is indeed the source of the 1 in 3 statistic for partner violence for women, this interpretation of the data is entirely incorrect. The meaning of these figures is; “Of the women who reported partner violence, 34.9% reported one incident and 65.1% reported more than one incident.” This can also be seen from the estimated number of persons at the bottom – 237,100 is not 34.9% of Australia’s population of women in 2012.
Table 4 will yield a 1 in 3 figure if statistics for partner and boyfriend/girlfriend as perpetrator of violence are added together, but that cannot be defined as “Domestic abuse”. The ABS can be quoted in order to clarify this point[5]:
“Partner violence
Refers to any incident of sexual assault, sexual threat, physical assault or physical threat by a current and/or previous partner. Partner violence does not include violence by a “boyfriend/girlfriend or date”. For the PSS a boyfriend/girlfriend or date refers to a person the respondent dated, or was intimately involved with but did not live with.“
Finally, the 1 in 3 figure can probably be obtained by adding the percentage of partner physical or sexual abuse to the figure for emotional abuse (25% for women, Table 32), but that too would be misleading because the ABS does not report overlap between the two phenomena in those statistics.
As such Plibersek’s source for the 1 in 3 domestic violence figure remains unclear. To their credit, ANROWS report these correctly – 1 in 6 for partner abuse and 1 in 4 for emotional abuse.
Another figure that stands out from the ANROWS document, although it is reproduced elsewhere on the internet, if one searched for it and the word “women” is:
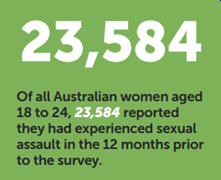
This one appears to originate from the same ABS study, table 13:
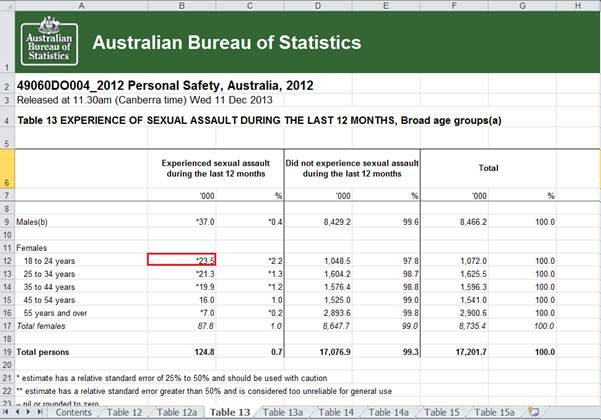
A keen observer would have noticed that the figures are in multiples of a thousand. The ABS is not given the resources to interview that many people in anything other than the national census. These are projected, rather than actual figures and therefore 23 thousand women did not report to have been sexually assaulted. This statement is misleading all the more so than this shocking statistic would have remained just as provocative if it said “estimated.”
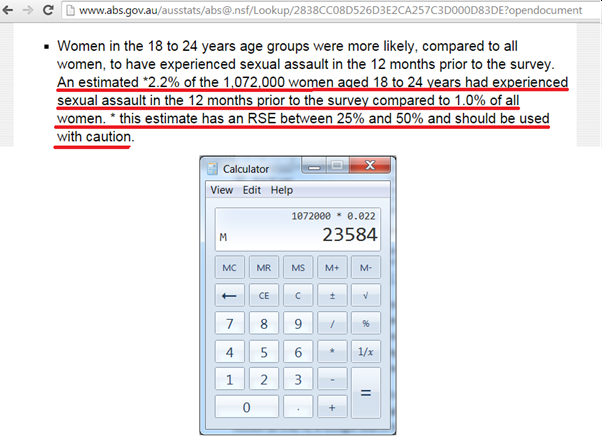
I was curious however, where did such a precise figure come from? Its symbolism is quite obvious, that not a single last victim is to fall into oblivion of cold mathematical rounding. And as fair notion as that is, a Google search for the number 23584 and various combinations of “ABS”, “women”, “assault”, etc, failed to reveal the source, until, I looked at ABS’s own PSS 2012 commentary and discovered the following paragraph.[6] Please note that an RSE (Relative Standard Error) is a statistical indicator of the level of accuracy of the reported figure when compared to the probable actual figure. It depends on sample size in relation to the real-world population (more on which below):
Peddling misleading figures hidden in pretty graphics is hardly a constructive way to approach an issue as serious as rape and sexual assault. Especially for a research body that relies on Australian taxpayer funding to “ensure the effective dissemination and utilisation of research findings,”[7] as the ANROWS mission statement reads. Their funding is at the time of writing, at three million dollars of taxpayer’s money, one might bear in mind, 1.25 million of which went to “Consultancy, contract, temporary staff and employee benefits,” with none on “services rendered,” as of the last financial statement.
But enough negativity, let’s try to effectively disseminate and utilise research findings, seeing feminism is not interested in doing so…By attempting to answer the question “What do the ABS PSS surveys tell us about violence against men and women?”
First and foremost – the surveys. There are three of them – two Personal Safety Surveys conducted with both men and women in 2012 and 2005 and an earlier Women’s Safety survey conducted in 1996, whose methodology was adapted for the later PSS’s. The ABS site claims that the results are largely comparable. Those unfamiliar with statistical methods may also need to note the following three concepts:
Projected results – these surveys are done with a sample of people much smaller than the entire population. Their answers are projected – one person’s response is taken to represent the typical response from x many persons in the wider population. When the number of people interviewed is large enough, this result is taken to be representative of the population on average and the bigger the sample, the higher is the probability of the figure being accurate. This is not meant to be deceptive. Rather, missing responses for a certain question would not require that person’s entire survey to be discarded. Each question can have its own sample rate, but as a result, needs to be projected to be meaningful in comparison with data for other questions and for the survey as a whole.
Sample Size – A much larger number of women has been interviewed for these studies than men. The reason is never explained, however the surveys original focus on women’s safety is of note. To wit, 31,650 women and 9,700 men were interviewed in 2012. The sample size makes the male figures less accurate, although accuracy of figures may have also been affected by people’s willingness to answer certain sections of the survey or the type of questions asked in each instance. This is not elaborated in the ABS notes, as far as I can tell. The sample size is a major factor that affects the RSE.
Relative Standard Error – the measure of accuracy of a particular figure. The 2012 survey divides these in three categories – 0-25% as acceptable, 25-50% as unreliable and over 50% as unacceptable. The technical notes for the 2012 survey explain the concept[8]:
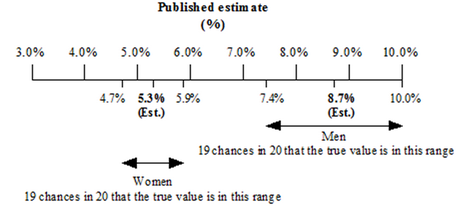
This means that the true results are not best represented by a bar graph, as is the common practice, but by an edifice with a fuzzy top, whose real value is somewhere in the mist of probability. An RSE of 25% or over means that the edifice is mostly mist and these are marked with a single asterisk throughout the survey, including its commentary. The larger the sample, the less mist there is – the 19 in 20 chances spread shown above narrows. It can also mean that results with overlapping RSE’s may not be statistically significant, meaning the fact that the results appear to be different is the product of chance rather than a true reflection of reality. Only the 2012 PSS tables have an accompanying table of RSE values, and while p51 of the 2005 survey[9] provides a guide to what the RSE should be, based on the size of the estimate, for the sake of this exercise we’ll stick to bar graphs.
So, the true sexual assault and violence statistics based on these Australian surveys look as follows:
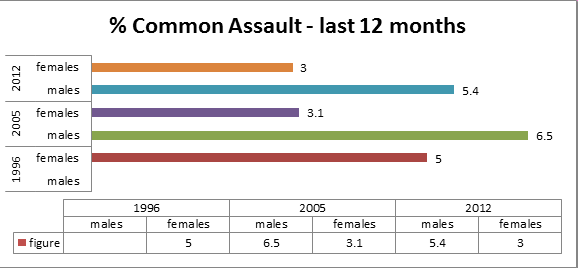
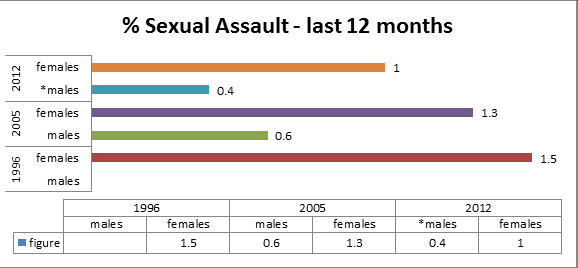
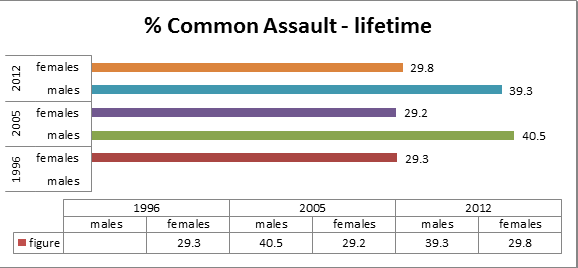
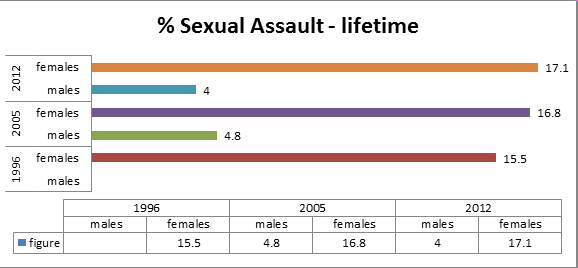
The tendency for recent assault is down, while paradoxically lifetime experience for women reporting sexual assault is up. What if anything that means cannot be reasonably surmised with too much confidence, remembering that each has an RSE and when the difference is in the realms of one percent between two surveys is most likely not statistically significant. However and cautiously, these figures ring true with the notion that Australian society is relatively safe and stable. Acceptance of female victims of sexual abuse is on the rise reflected by an upward trend in reporting lifetime versus a decline in recent sexual abuse. The taboo on men reporting violence and especially sexual violence against themselves appears to endure.
The statistics for partner violence across the three surveys appear as follows:
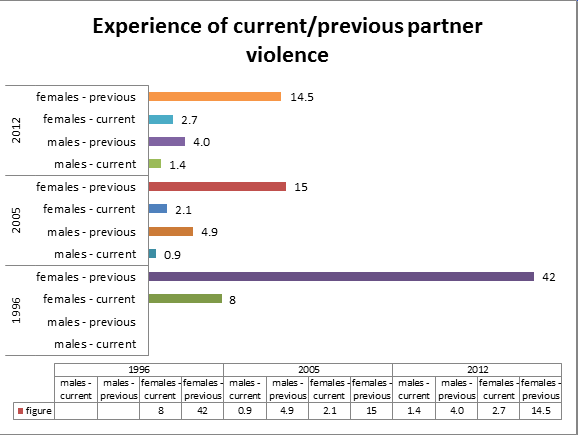
Of note, there is a substantial difference between 1996 Women’s Safety survey and the later PSS’s. This may reflect a difference in methodology, evidenced by the fact that the PSS surveys do not attempt to compare partner violence statistics as they do assault and sexual violence statistics. The overall picture seems consistent with the previous graphics – general stability with some evidence of decline in the incidence of violence.
With that in mind, the millions of funding that bodies such as ANROWS receive seem to be feeding an advocacy industry that has little to no effect on rates of assault. Violence and sexual assault is a problem for everyone but it appears to be on a gradual decline. Neither the politicians brandishing the “I am a feminist” slogan, nor the advocacy bodies set up to “deal” with the issue seem to be interested in offering any true perspective on the real magnitude of the problem or trends over time. The casual observer is not expected to examine statistics on their own and as such will most likely be misled. Misinformation is not a good use of tax-payer’s money and above all is unhelpful to the victims of violence.
[1] http://www.smh.com.au/comment/tanya-plibersek-why-im-a-feminist-20141112-11ktdn.html
[2] http://www.smh.com.au/federal-politics/political-news/im-no-feminist-julie-bishop-20141029-11dn7m.html
[3] http://www.anrows.org.au/sites/default/files/Violence-Against-Australian-Women-Key-Statistics.pdf
[4] http://www.abs.gov.au/AUSSTATS/abs@.nsf/DetailsPage/4906.02012?OpenDocument
[5] http://www.abs.gov.au/ausstats/abs@.nsf/Lookup/4906.0Chapter7002012
[6] http://www.abs.gov.au/ausstats/abs@.nsf/Lookup/2838CC08D526D3E2CA257C3D000D83DE?opendocument
[7] http://anrows.org.au/sites/default/files/page-attachments/ANROWS%20Annual%20Report%202013-14_web.pdf, p8
[8] http://www.abs.gov.au/ausstats/abs@.nsf/Latestproducts/4906.0Technical%20Note12012?opendocument&tabname=Notes&prodno=4906.0&issue=2012&num=&view=
[9] http://www.ausstats.abs.gov.au/ausstats/subscriber.nsf/0/056A404DAA576AE6CA2571D00080E985/$File/49060_2005%20(reissue).pdf